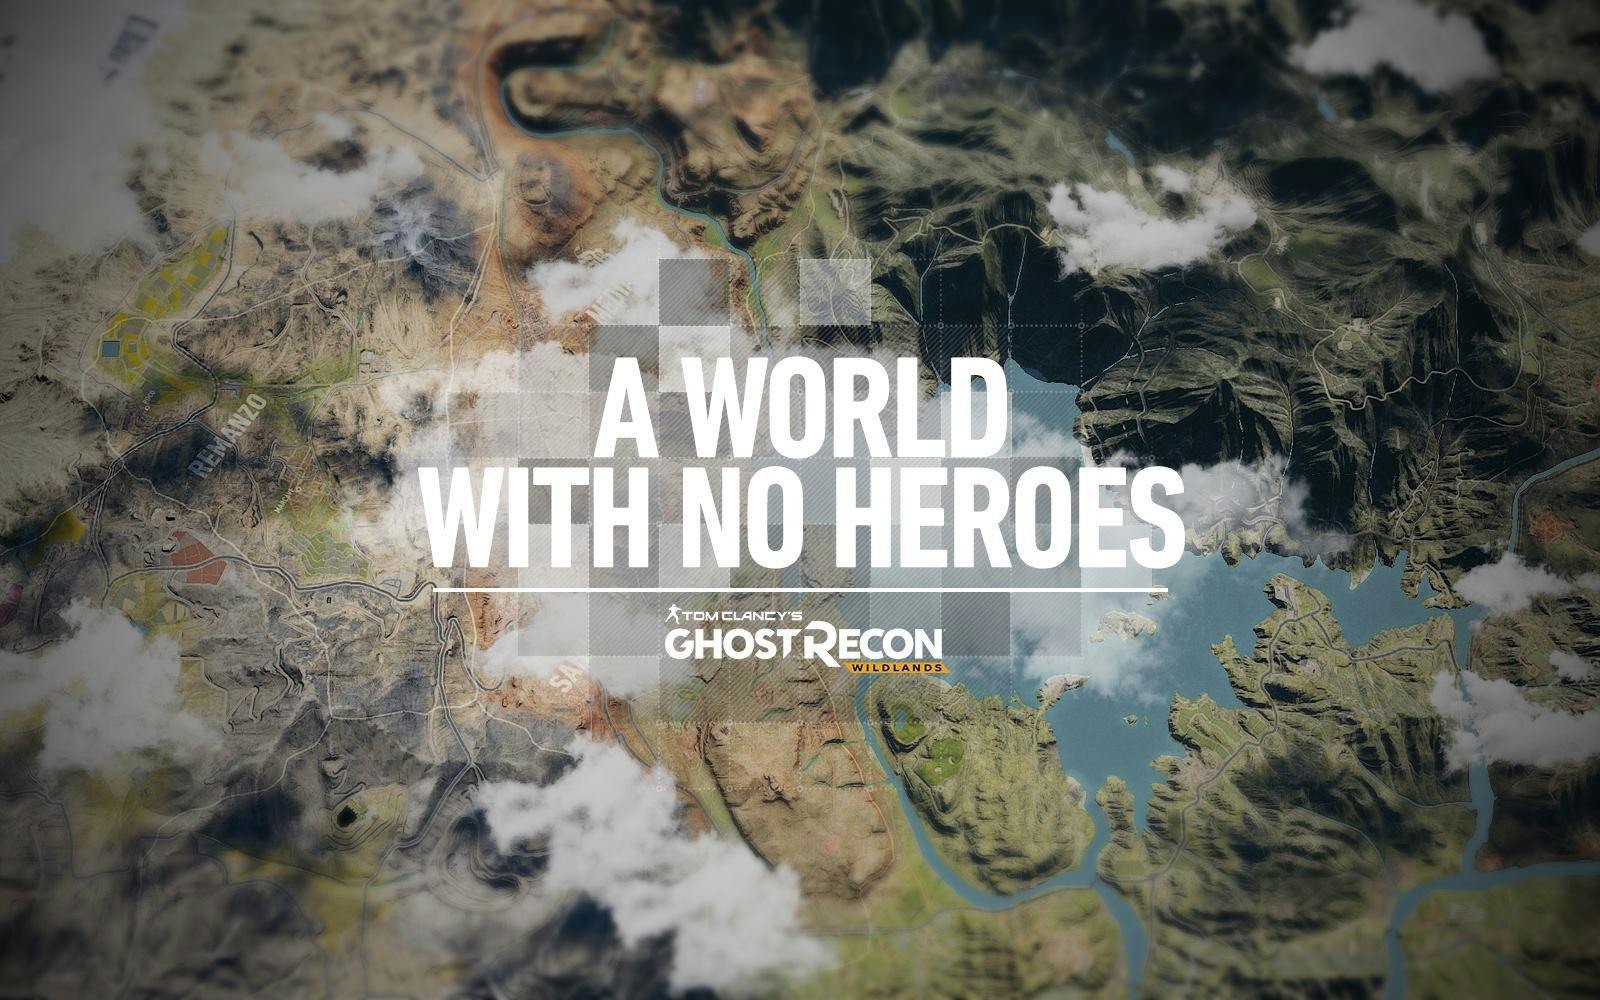
A World With No Heroes
Behind the scenes: production of a living WebGL map
In February 2017 we released a campaign website to promote the launch of a new video game, Tom Clancy’s Ghost Recon Wildlands. Made in collaboration with DDB Paris for Ubisoft, noheroes.ghostrecon.com recently won the Awwwards and CSS Design Award Site of The Month (March 2017). Since there’s interest in the work we thought we’d share a bit about our production process, creative tips and technical tricks.
Concept
A unique and immersive experience that puts the user at the heart of the storyline: from the first gunfire to a grisly end, follow the narrative of a cocaine heist gone wrong via surveillance cameras dispatched throughout the real Wildlands map, beautifully recreated for web (desktop and mobile) in real-time 3D with NanoGL.
By day or by night, users can explore the stunning beauty of Bolivia, from sumptuous landscapes to persecutions and guerillas, discovering as much as eight hours of teaser content through 50 cameras triggered through autonomous, systemic events.
Experience the story differently through a second, data-driven map. From here witness the brutal cost of human life in blood, cash and cocaine as you explore each location and new events are triggered.
In this article, we will focus on the map.
Technical challenges and motivations
We had three goals:
- Render a “living” map
- Provide a smooth WebGL experience on both desktop and mobile
- Test and improve our in-house WebGL micro-framework, NanoGL
Let’s begin !
3D pipeline
From provided textures to meshes
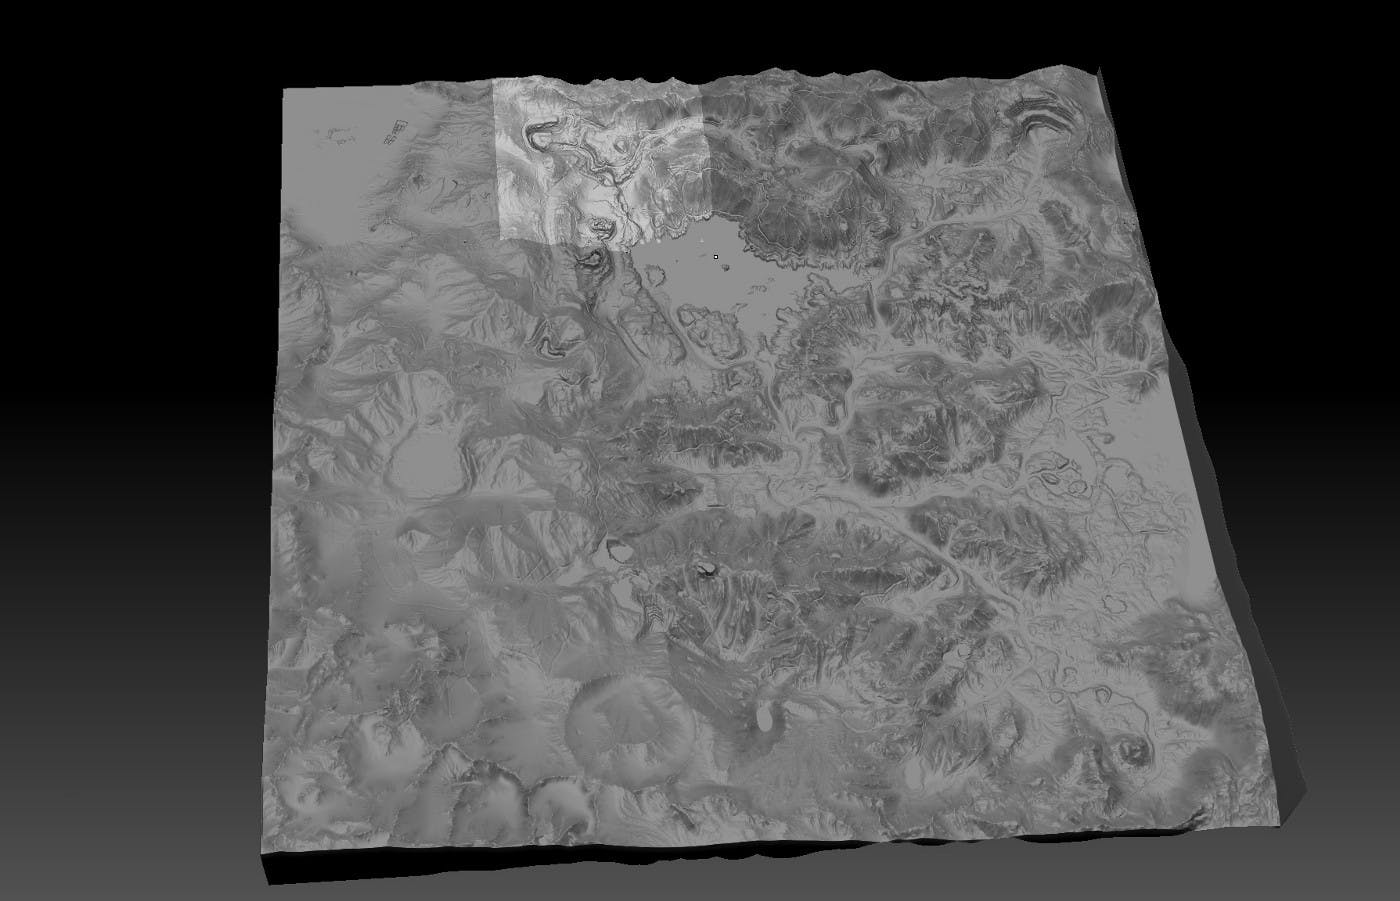
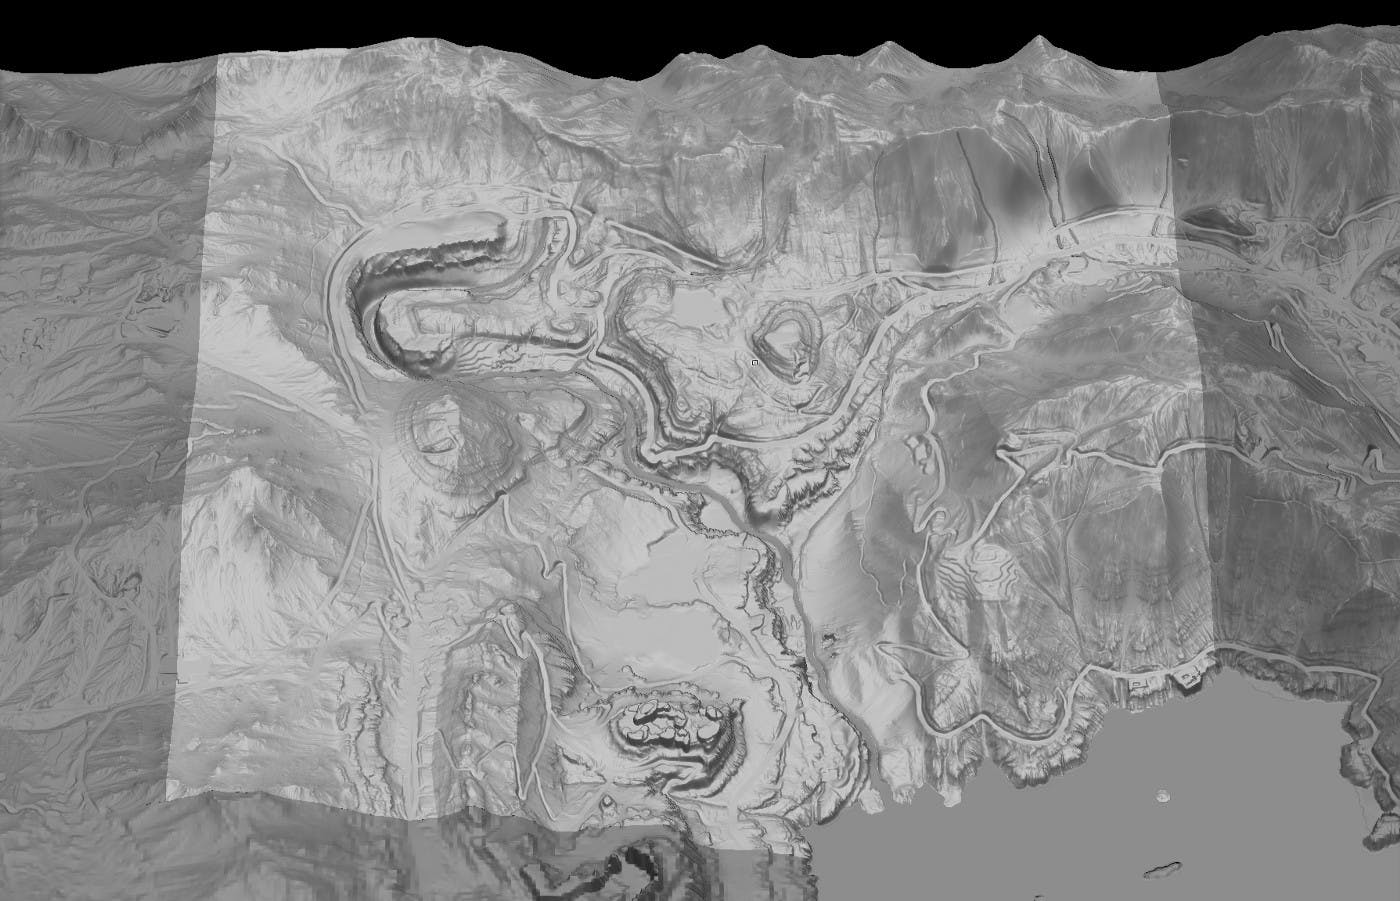
The immediate challenge was to generate the map model using super high-resolution assets provided by Ubisoft: a PSD file containing the albedo map along with the heightmap.
Here’s what they look like:
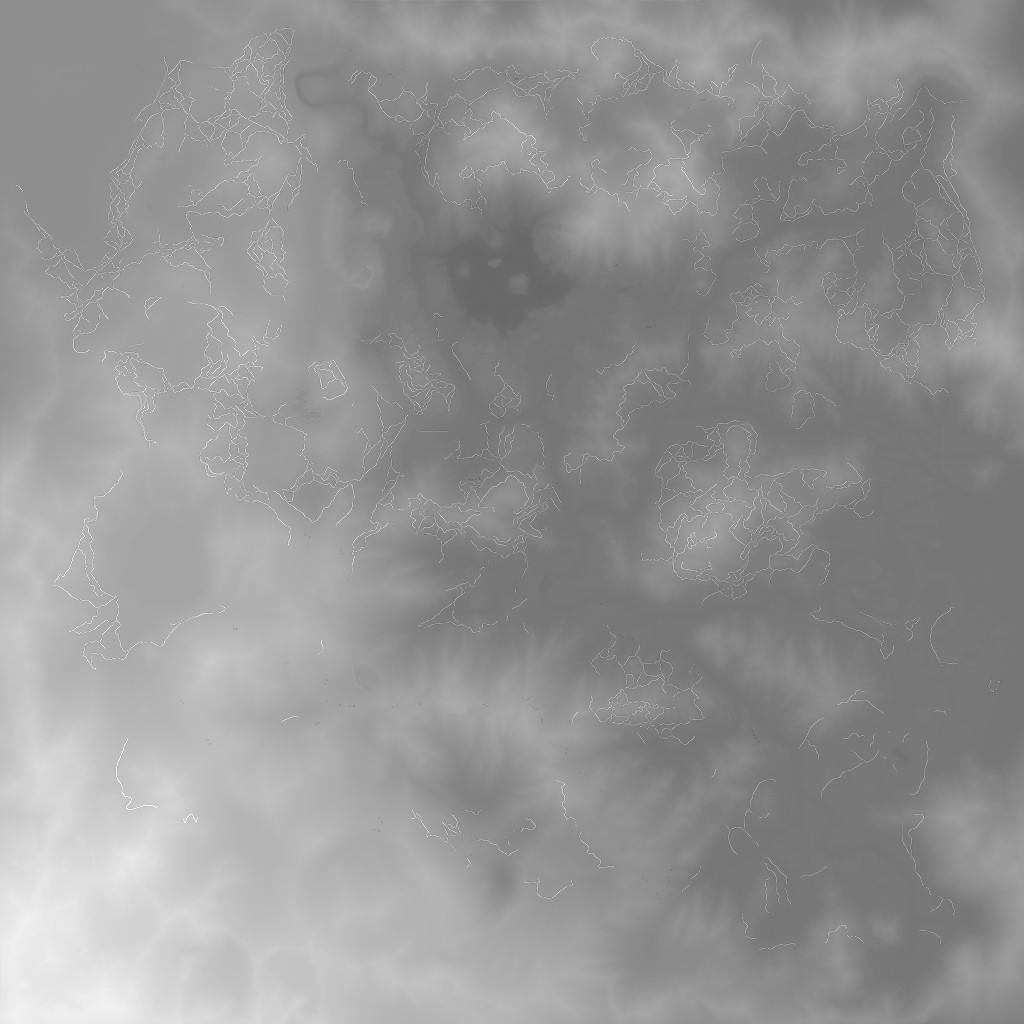
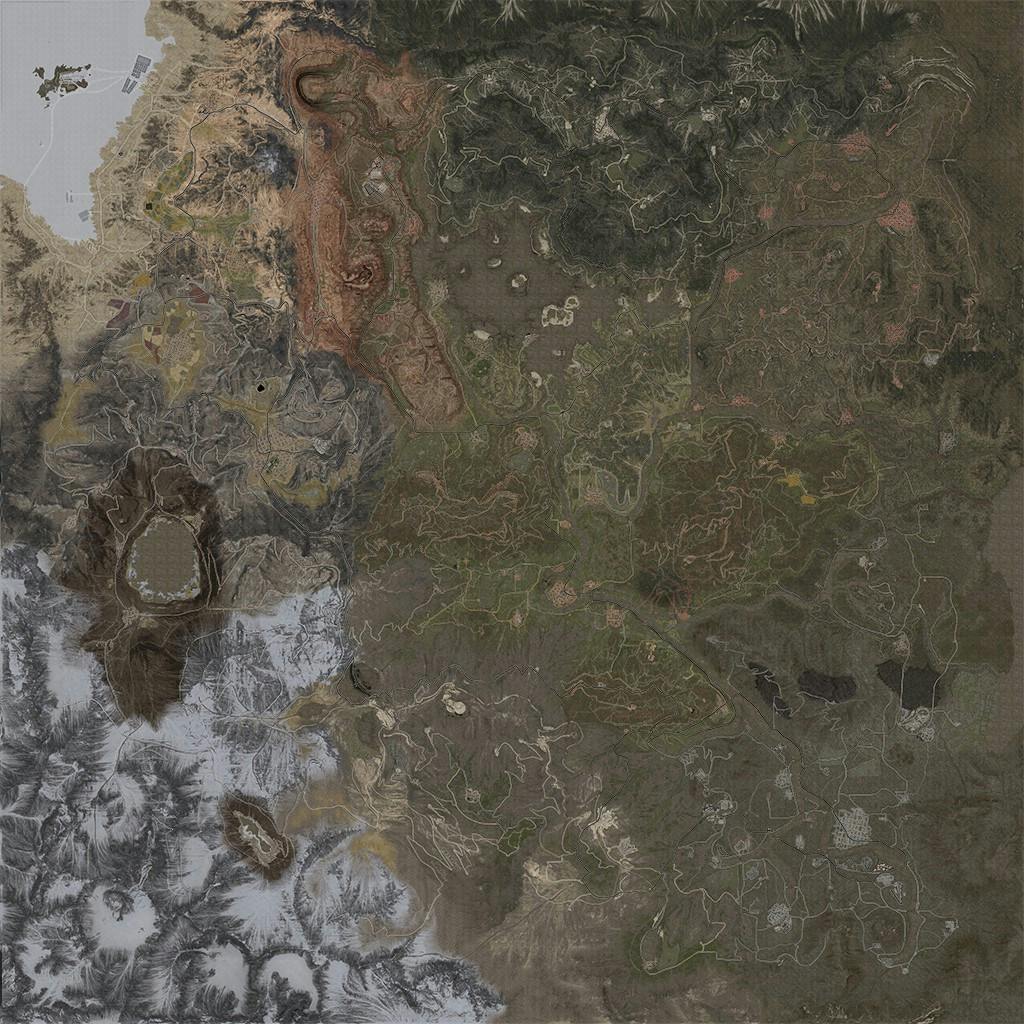
Those maps are 8k x 8k each. We wanted to create accurate meshes so, for each pixel, one vertex. Yes, this is a lot: 8192x8192 = 67 million vertices. We then split the mesh into 16 tiles (4x4). Here’s what it looks like after creating the meshes from the heightmap:
Now we had workable meshes, but we had a quite high number of vertices too. Obviously, 67 million is too many to load so we used Zbrush and its decimate tool to reduce the number of vertices. And that’s how we generated two meshes for each tile: a 2k vertices version and a 8k vertices version.
To gain more space, we also removed unused data at export: normal, binormal and bitangent. You would usually need those data for normal mapping. However, we knew we would have a planar shape at the end and we could calculate those data in the shader; so it made sense to lose it here instead and save about 50% on file size.
Browser-side, we based our NanoGL workflow on the AWD format. This format allowed us to export a whole scene with many meshes and included data. The goal of this format is actually quite similar to the new GLTF format. From here, once the file is loaded, our NanoGL PBR material takes care of the rest to create the most realistic display possible for the map.
Home screen
This is a location-based concept and UX, so loading the map before anything else was a no-brainer. Problem was, we couldn’t know for sure whether the minimum number of map assets required to display something useful on screen would load in that first few seconds. To overcome the risk we used the “dive” transition and here’s the trick: we took a screenshot from the WebGL map, without the clouds, at maximum altitude; we used this screenshot as the background of the HTML home screen and drew some clouds flying around on a canvas on top of it; then, at transition time, we simulated the dive by scaling the background and the clouds; finally we switched to the map which continues to dive into the interactive content… Does the job, right?
Life
From a static map to a living world
Injecting life into the map in a believable way was one of our main challenges; so let’s talk about a few of ideas we eventually implemented to help make this feel legitimate.
Day / night cycle
Let’s say a day/night is x shades of colors, therefore we can represent it as a gradient like the one below:
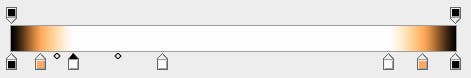
Now, according to the time, you can get the shade of the day at that precise time and adjust the color of the map with a “light” picked from that gradient. For even greater accuracy, you can define a gradient “per thing to render”. For example, we have another one for the clouds.
Here’s a timelapse from 10am to 10am the next morning:
Adding shadow mapping increases the effect further if you simulate the sun curve along its journey. So at noon, you’ll have short shadows and at sunset, you’ll have long ones. On a general note, adding shadow to any scene adds realism as it gives visual information about objects’ depths and positions.
As a test, here’s what it looks like without shadow mapping :
Clouds
Clouds contribute a lot to the altitude effect when diving in and out, but putting a few clouds floating around wasn’t really… realistic. So once again, shadows helped a lot, though we didn’t use shadow-mapping here because you can’t get smooth shadows. (Actually you can, but your fans won’t be happy. Find more information about how to make shadow mapping here.) Instead, we decided to render all the clouds in a black and white render target according to the position of the sun. So, in the morning the x offset will be negative and in the evening the x offset will be positive. We then pass the texture from the render target to the map material and apply it in additive mode.
Cars
It’s all about the details, right? Traffic on the map is not really visible by day, but once night has fallen car headlights appear just as you’d expect. We’ve gone that far because these are the kinds of details you notice more when they are missing from a living experience like this.
We achieved this with mesh instancing (same as with the birds we will talk about in a moment). This technique allows to render multiple copies of a mesh with different parameters in a single draw call. In this case, the mesh is a simple plane and because we’re looking at the map from a bird’s-eye view, a small flat plane does the job.
Mesh instancing is often seen as a complex thing, but it’s actually quite simple. Here some sample extracted code:
// we chose randomly 256 to let the road not too busy, but you can go crazy here
var MAX_CARS = 256

// In WebGL 1, this is actually an getExtension
// In WebGL 2, this will be native
this.ext = gl.getExtension( 'ANGLE_instanced_arrays' )

// bind the buffer with the program that will receive the data
this.sbuffer.attribPointer( prg )

// iPosition and iDirection are both attributes retrieved in the vertex shader
this.ext.vertexAttribDivisorANGLE( prg.iPosition(), 1 )
this.ext.vertexAttribDivisorANGLE( prg.iDirection(), 1 )

// draw all the cars in one shot
this.ext.drawArraysInstancedANGLE(gl.TRIANGLE_STRIP, 0, 4, MAX_CARS)
The syntax in the example is entwined with NanoGL, but if you want to go full native, you can find out more about this topic here: http://blog.tojicode.com/2013/07/webgl-instancing-with.html.
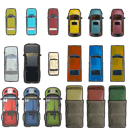
To reduce memory, we used this atlas texture and played with UVs to display different types of car.
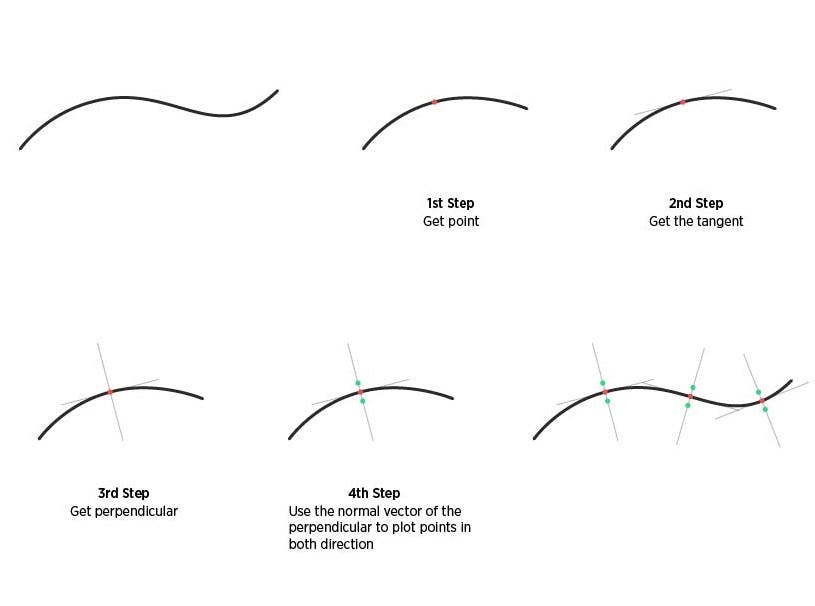
That’s it for the display. For the motion, we created some bezier curves on the 3D software. From there, it’s easy to plot more or less points along the paths. Exactly what we wanted on WebGL side.
One of the most awesome and powerful things with 3D software is its scripting capabilities: you can walk through your scene with code (for example Python for Blender) and export data on a file; once the file generated, browser-side you can create Catmull-Rom splines from the file’s data and then move objects along this path. Like the headlights, it would just feel odd if the cars were only moving in one direction. So here’s the trick we used, illustrated, for two-directional traffic on a single road:
Birds
Birds are another detail like the cars that are small but contribute a lot to the feeling that the map is alive and not static. The first question we asked ourselves was how big they should be and it quickly became obvious they would be pretty small so as to not obstruct the map. Because they’re small we were able to use a kind of cheat with a simple mesh that’s a sort of deformed diamond formed by two triangles: then you can rotate up and down the left and right vertices to simulate the movement of wings. Neat huh?
Here’s a schema:

Instead of traditional motion methods that might require fancy CPU computing at runtime or snazzy GPGPU we made the flocking birds with splines too, built of curves in Blender and exported the same as for the road traffic.
Then each bird has an offset value along the curve so all birds together form a group.
More details please
Early in the project we received some models from the game that we knew we wanted to integrate:
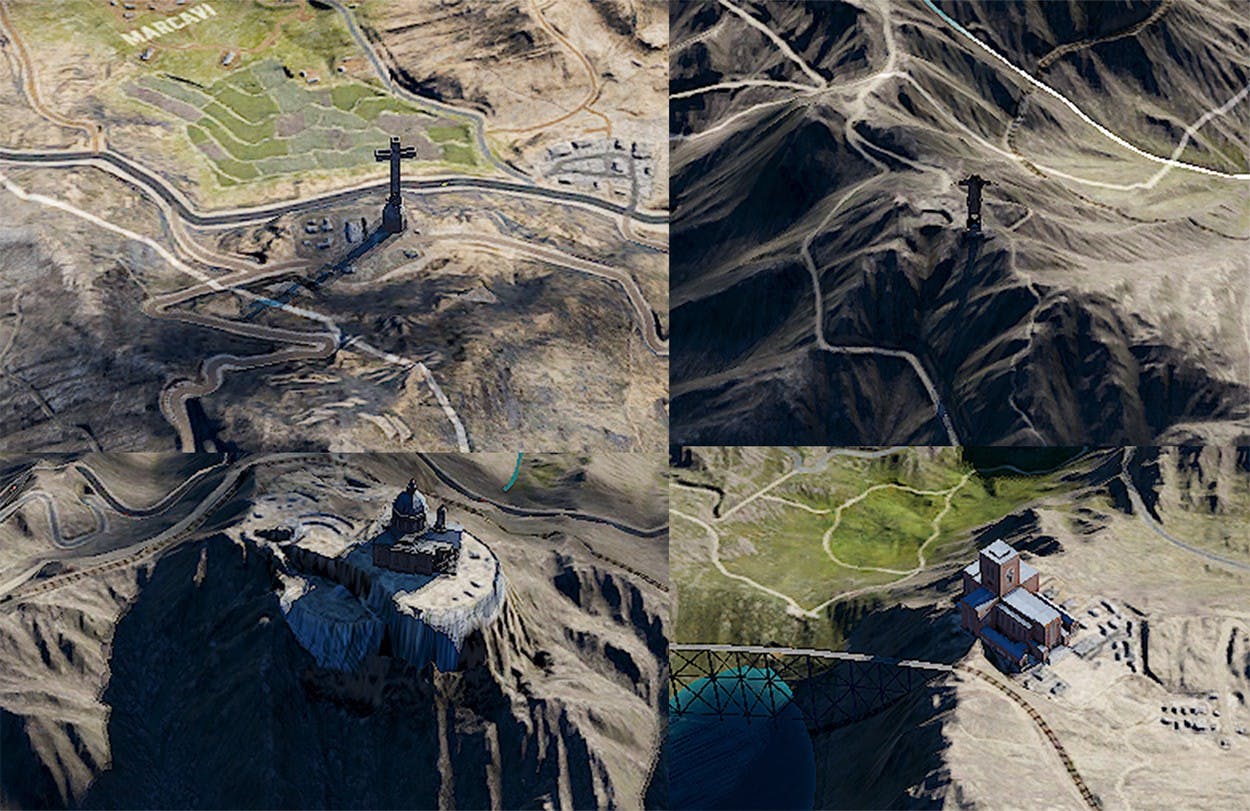
As the models are coming directly from the video game the level of detail on them is super high. However, in our scene, the elements are quite small once projected on screen — like 100x100 pixels. It meant we could reduce the detail in the geometry to make gains in performance and memory, so we did some tedious retopology work to reduce the number of vertices. Generally speaking, it’s important to always ask yourself how close you are going to see the object in your scene to decide how much detail you need in the geometry.
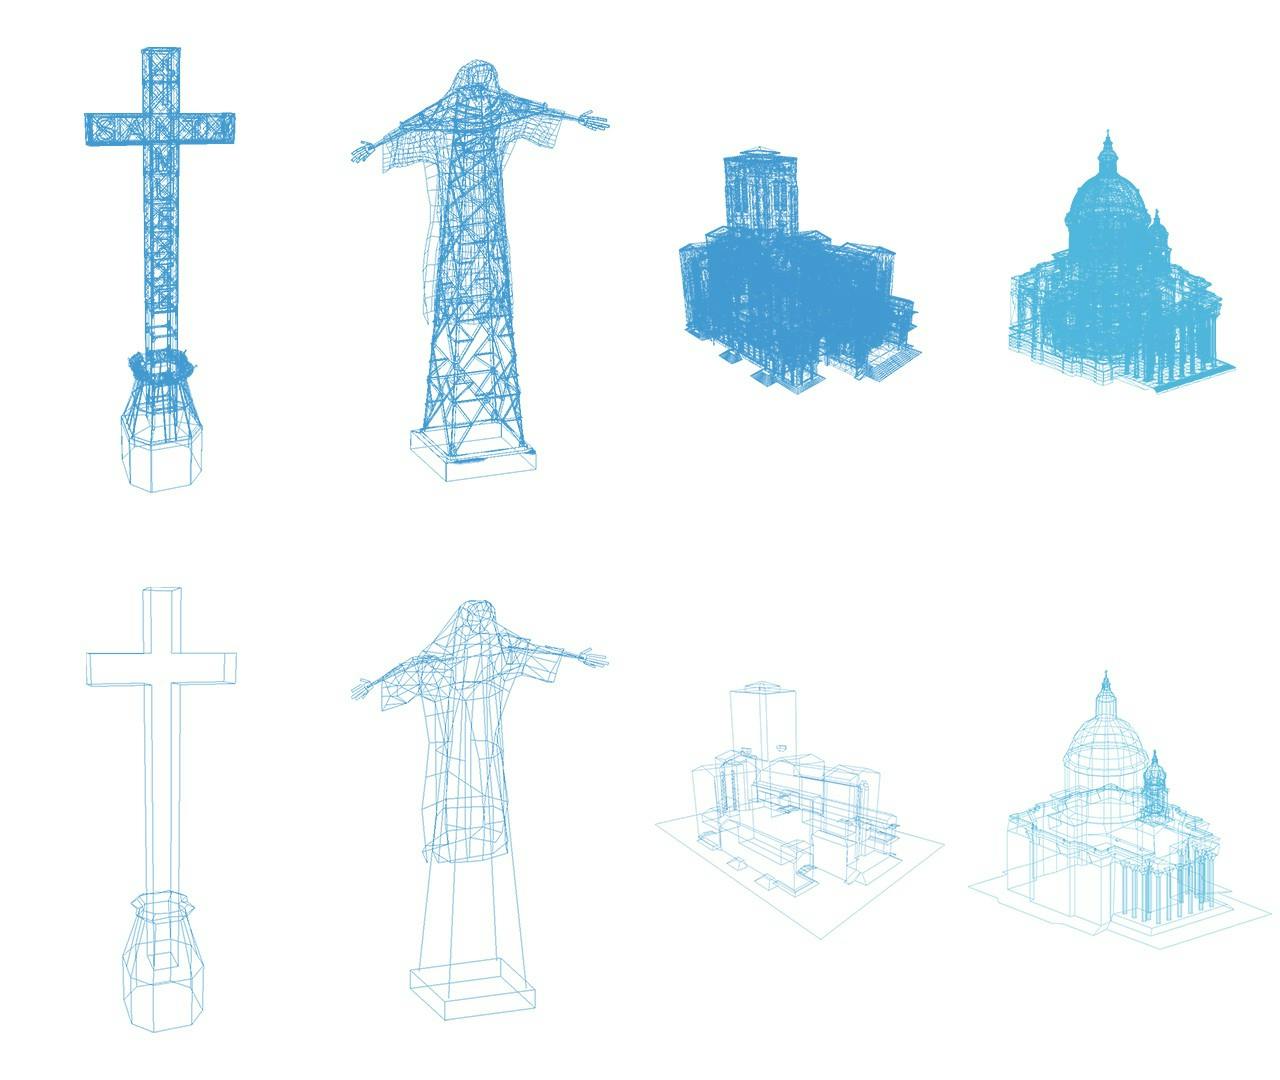
Here some before/after screenshots.
Pins
Initially we worked with a motion designer to quickly prototype one pin (representing a surveillance camera) and the effect when you pass over it with your mouse. Here’s the original animation from the motion designer:
“Ok what do we have here. Rotation… scaling… clipping.” After few hours, for piece of mind, we realised it would be better to use multiple layers to compose the final drawing because in the end you can assemble them just like that in Photoshop. The layers here are offscreen canvases/contexts.
Here’s an exploded view of the different layers — texts and their background are just plain HTML:
So we have our pin. We’re happy with it. We ended up with 8 HTML elements for a pin. Now let’s just multiply this pin by 50 and we can move on something else… or not. Now we had 40 fps (frames per second). After optimizations. Wait, what? We just lost 20 fps? It turned out the browser wasn’t so happy with 50 elements (and their children) moving around the screen while manipulating and rendering the heavy map behind them. After struggling a lot and optimizing here and there, we couldn’t get back to the constant 60 fps. So we moved those 50 pins to WebGL, again in a single draw call. At setup time, we made a geometry and each vertex of this geometry represents a pin, we then rendered this geometry as points. It was a perfect fit as gl points are always facing the camera… just like a HTML elements! And you can easily control the size of the point in the vertex shader with gl_PointSize.
The same way we gave each pin a position, we could also give it additional information like size, color etc via its attributes.
Here’s some pseudo code:
javascript
// All the data for one pin will be store in a single array
var geometryData = []

//run through to all the pin data
for ( var i = 0; i < pinsData.length; i++ ) {

  var pinData = pinsData[i]

  // position, remember, position x, z are coming from the svg
  //and y coming from the heightmap data
  geometryData.push( x, y, z )

  // UV will define which icon to display
  var iconUv = []
  switch( pinData[i].info.icon ) {
    case "airport":  iconUv = [ 0, 0 ]; break;
    case "church":   iconUv = [ 0.5, 0 ]; break;
    default:         iconUv = [ 0.75, 0.25 ];
  }
  geometryData.positions.push( iconUv[0], iconUv[1] )

  // repeat for background uv, scale, color...

}

// we have our data, let's create our buffers and bind the attributes
// ArrayBuffer is a useful helper within NanoGL https://github.com/plepers/nanogl/blob/develop/docs/arraybuffer.md

this.vertices = new Float32Array( geometryData )
this.buffer   = new ArrayBuffer( gl, this.vertices )
this.buffer.attrib( 'aPosition', 3, gl.FLOAT )
this.buffer.attrib( 'aIconUVOffset', 2, gl.FLOAT )
this.buffer.attrib( 'aBackgroundUVOffset', 2, gl.FLOAT )
Vertex shader
attribute vec3 aPosition;
attribute vec2 aIconUVOffset;
attribute vec2 aBackgroundUVOffset;
// add more attributes here : scale, color....

uniform mat4 uMVP;

varying vec2 vIconUVOffset;
varying vec2 vBackgroundUVOffset;

void main(){

  gl_Position = uMVP * vec4( aPosition, 1. );
  vIconUVOffset       = aIconUVOffset;
  vBackgroundUVOffset = aBackgroundUVOffset;

}
Fragment shader
uniform sampler2D uIconsTex;
uniform float uTime;

varying vec2 vIconUVOffset;
varying vec2 vBackgroundUVOffset;

void main(){

// texture slice size
float uvSliceX  = gl_PointCoord.x / 4.;
float uvSliceY  = gl_PointCoord.y / 4.;

// icon
vec2 iconUV = vec2( uvSliceX + vIconUVOffset.x, uvSliceY + vIconUVOffset.y );
vec4 tIcon = texture2D( uIconsTex, iconUV );
vec3 iconColor = vec3(1.) * tIcon.rgb;
float iconAlpha = tIcon.a;

// background
vec2 bgUV = vec2( uvSliceX+bgUVOffset.x, uvSliceY+bgUVOffset.y );
vec4 tBackground = texture2D( uIconsTex, bgUV );
float backgroundAlpha = tBackground.a;
vec3 backgroundColor = tBackground.rgb * backgroundAlpha;

// mix the two colors to get your pin !
vec3 finalColor = mix( backgroundColor, iconColor, iconAlpha );

gl_FragColor = vec4( finalColor, backgroundAlpha );}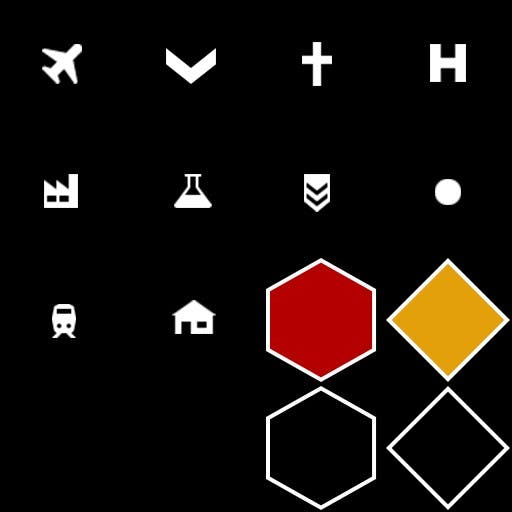
And here’s the texture atlas for the pins.
We made use of the work we had done to date on the HTML pin as the mouse-over effect was good and ready, and doing it again in WebGL would have been a pain. So, every time the user moves his mouse around the screen, we check the closest pin (now in WebGL) and move the HTML pin to that closest pin. Then once the user goes over a pin we just have to trigger the HTML animation. With this little gimmick the illusion is complete and everything now looks seamless to the user.
Back to 60fps!
Illustrator workflow
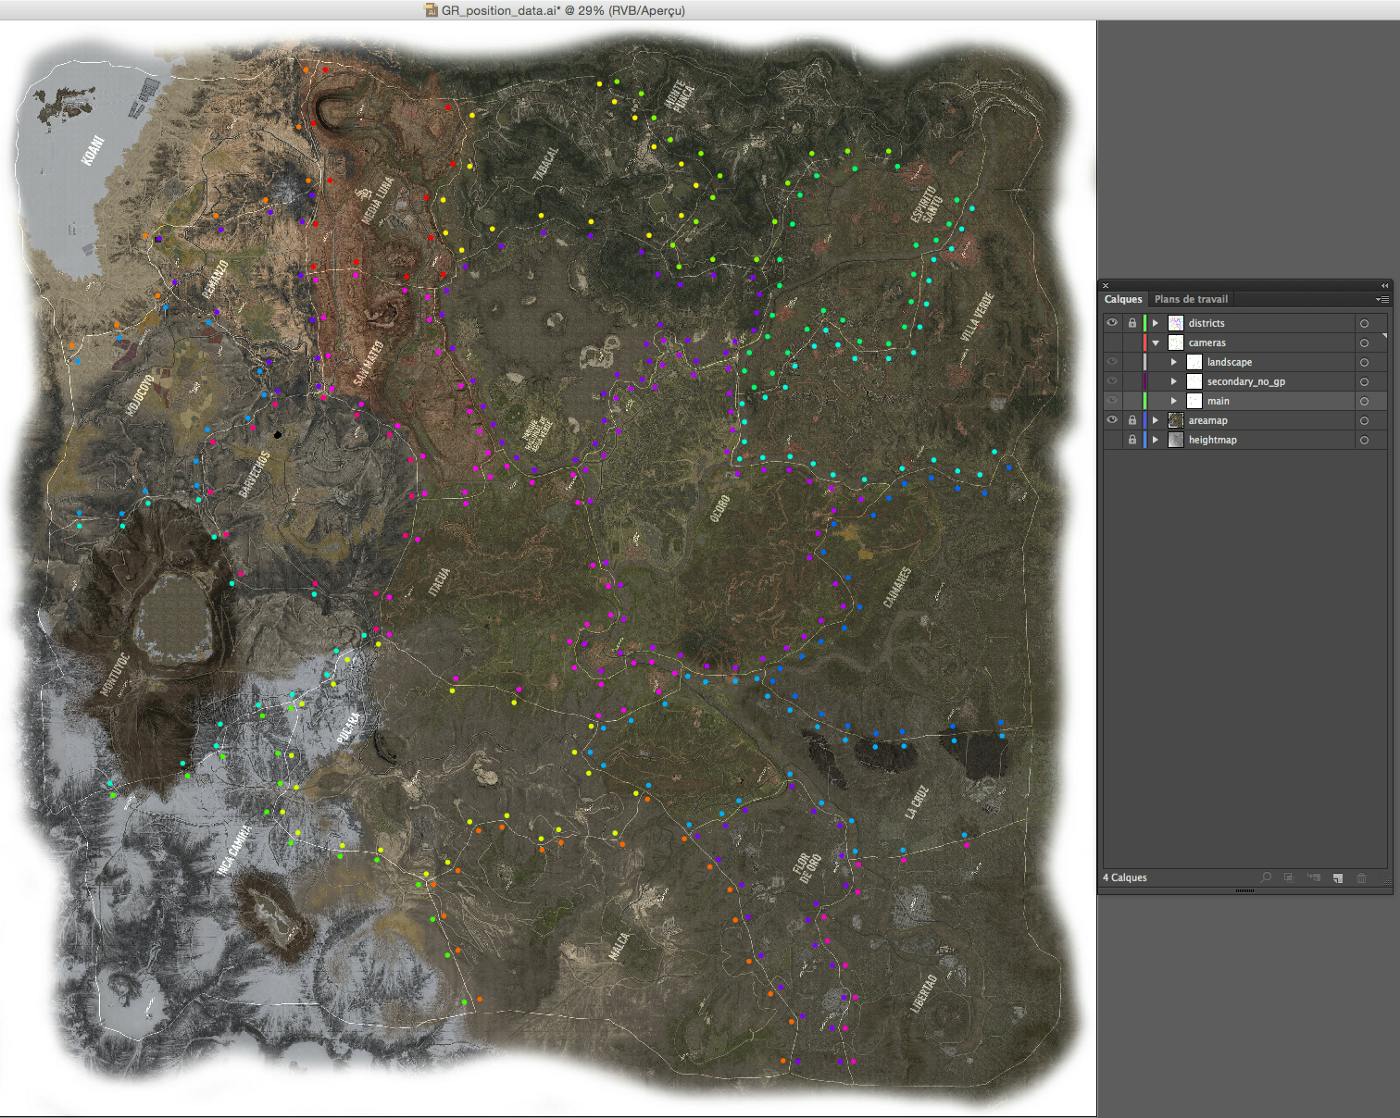
Being flexible about positioning stuff in the scene was a key to keeping productivity high and to avoid wasting time changing cameras. At makemepulse, we often use Illustrator as a medium across designers and developers. Designers can visually manipulate things and developers can export the file as svg file and parse it later via the DOM API back in javascript land.
Recon map
Look and feel
The recon map is completely different render of the model where time is paused and we display additional information relative to the story. Recall the creative concept for the campaign, which was to bear witness first person to the influence of the Cartel. This is represented in the recon mode aesthetically by cocaine, covered with fresh blood, spilled at the location you have just performed a recon.
For the cocaine we used a flour texture, controlling its resolution and tint to get to what we were after.
For the freshly-spilled blood, we referenced photography of the real thing and tried to isolate what components made it feel “fresh”. Some shaders and experimentations later, we ended up with this — a glorious red color coupled with some nice looking reflections:
For the ink effect we used a set of Photoshop brushes on a black & white canvas texture. Each time a pin is completed, we get its location and make a random ink drawing from the set at that location. This texture then acts as a mask for the blood.
Transitions
Under the hood, there are different shaders/materials for the normal mode and the recon mode. At rendering time, we render the map with one or the other material so only one mode is rendered at a time.But when the transition is triggered, for few seconds, both materials have to be visible. The trick here was to render the map into framebuffers.
// Render the scene twice in FBO objects during the transition
// otherwise, render only one of the modes
// We're using our NanoGL helper here for conveniance
// https://github.com/plepers/nanogl/blob/develop/docs/fbo.md

function updateFbos(){
  this.scene.renderTactic( this.tacFbo )
  this.scene.renderMap( this.mapFbo )
}
This makes everything easier as the whole scene is rendered to a render target. During the transition both modes are rendered. We can then mix the two textures extracted from the render targets. You may have guessed the propagation effect is made with a noise. For performance, we used a texture.
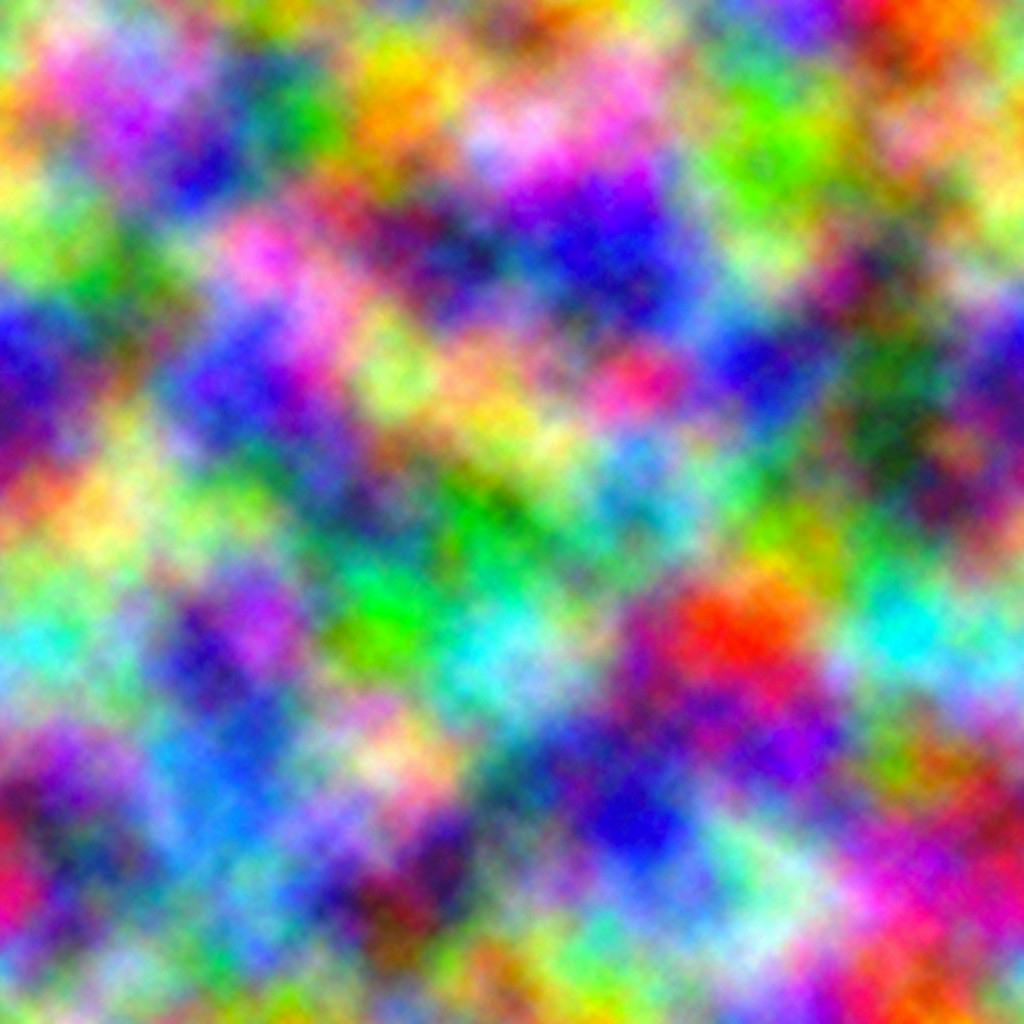
You’re probably used to seeing black and white textures for noise effects; we chose a colored one because it allows more variation in the sampling.
So instead of getting only one value, let’s say the red value, we mix all the channels:
float pertub = uNoiseTex.r*0.3 + uNoiseTex.g*0.3 + uNoiseTex.b*0.3;
Loading strategy
The total weight of the website is quite high, nothing surprising for this type of WebGL website.
The map alone:
- Desktop low quality : 36Mo
- Desktop high quality : 86Mo
- Mobile low quality : 16Mo
- Mobile high quality : 36Mo
Needless to say we can’t load everything at init time, but this doesn’t mean we can’t try to be smart and load assets sparingly. We’re now in the habit of generating three levels of textures: 512x512 / 1024x1024 / 2048x2048 (it’s integrated in our NanoGL workflow). Those sizes define the setting quality LQ, MQ, HQ. Also, you probably noticed that the desktop low quality assets size is similar to the mobile high quality assets size. That’s because we usually set the “low quality” settings as medium quality under the hood on desktop. The same way, on mobile the high quality is actually the MQ and the low quality, the right LQ.
Additionally, we pre-select the users quality based on their internet connection speed, calculating this by the elapsed time it takes to preload the introduction video.
// on app start
var START_TIMESTAMP = Date.now()

// listen to the video when it will available
video.addEventListener( "canplay", onVideoCanPlay )

// Calculate how much time the user got to that point and
// define quality to low here if the elapsed time
// is under your threshold
function onVideoCanPlay() {

  var startElapsedTime = Date.now() - START_TIMESTAMP
  if ( startElapsedTime > LQ_THRESHOLD ) {
    APP.QUALITY = 'low'
  }
}
We wanted to start loading map assets simultaneous with the video playback, but this was actually a bad idea as the browser prioritizes the assets loading over the video and resultantly, the video just kept buffering. As a solution we wait for the video to be completely preloaded and only then start loading map assets. Unfortunately HTML5 isn’t cool enough to provide an event to let you know this information, so we make a dirty check:
// RAf is a simple little helper we use as a shortcut
// for the RequestAnimationFrame API
// https://github.com/makemepulse/lol.js/tree/master/raf
RAF.subscribe( 'video-check', checkVideoLoading )

function checkVideoLoading () {

var bufferLength = video.buffered.end(video.buffered.length-1)
  if ( bufferLength / video.duration >= 1 ) ) {
    this.onVideoPreloaded() // start preloading map assets here
  }

}
Typically by the time you land on the home screen the loader has moved past 0% and you’ve gained a few seconds, but if the user then chooses the HQ option… we have to load a tonne more assets (remember the 8k vertices tiles generated earlier?). So as not to create a confusing UX for these users we made the decision to not show any loader and to ghost load the assets instead, swapping textures and models on-the-fly. To be as efficient as possible, we first load the tiles visible on the screen and then expand the loading from this point.
Here’s a schema of the idea:
Additionally, we’re doing some LOD work on meshes as well. This means we adapt the number of vertices displayed on screen according to their distance from the camera and as we start quite far from the ground at the beginning… there’s not much chance you’ll see the swap happening.
Sound design
Like any video game, when you add the sound dimension you reach another level of awesomeness. For Wildlands we worked once again with Press Play On Tape (previously collaborating on Scars, For Honor) to deliver an original and top quality experience.
The process of integrating sound was made almost at the end of the project. This is not a bad thing because it meant we could provide screencapture of the website to clearly communicate the context to the sound designers, as opposed to a static jpg with lots of pointing and explanations of “we can click on that, on this” etc.
There are 3 “layers” of sounds:
- main theme sound
- area sounds
- interaction sounds
The main theme comes directly from the video game. The sound mechanism is quite simple, the higher the altitude, the higher the volume of main theme will be.
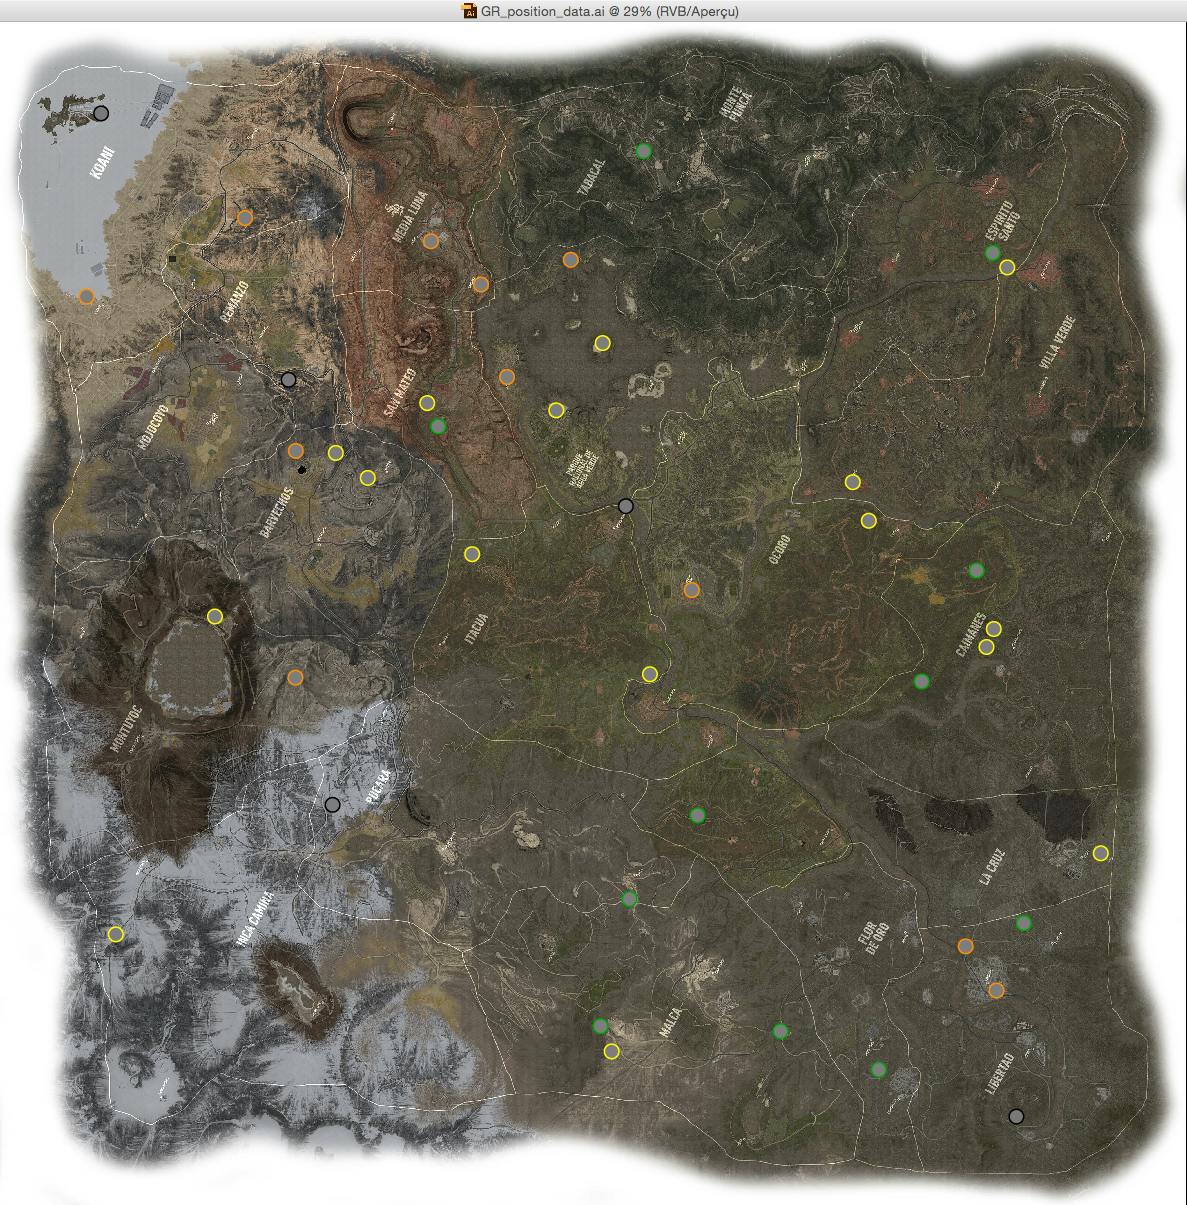
The lower the altitude, the higher the volume of each map area will be. To detect which area is the closest to the camera (center of the screen), we used the same SVG file seen previously. On another layer in Illustrator, we placed boundary points for each area, so every time we move on the map we can check the closest border. Each point stores information about which area it belongs to. Here’s an image.
Technically, using NanoGL is a big win for us. It’s been a while now since we completely dropped common WebGL libraries to have a full control over the pipeline in the browser and answer specific problematics, and are quite happy with this decision. We’ve covered a lot of ground on this here, but there’s more if you’re interested (video tracking, mini games in the videos, PBR material, etc.). Feel free to ask us anything @makemepulse.
This project has been really important for us, for DDB and Ubisoft as it was significant part of the launch strategy for the game. Ghost Recon Wildlands is Ubisoft’s best forming beta to date so for us this campaign feels like a huge success.
We hope you enjoyed the reading and if you haven’t seen the website yet, check here : http://noheroes.ghostrecon.com